.png)
Bonvista Financial Services Pvt. Ltd.
Every time the Indian stock market touches a new historical high, the exact same question starts appearing on television, social media, and WhatsApp groups: "Is the market overvalued?"
Consequently, many retail investors in India become nervous. Some stop their Systematic Investment Plans (SIPs), others sell their existing investments, while a few keep waiting on the sidelines for a big market correction that may or may not ever come.
If you have ever wondered whether you should continue investing when markets are at record highs, you are not alone. The good news is that understanding market valuation is much easier than it sounds. According to wealth management experts, successful investing depends on discipline, not prediction.
What Does 'Overvalued' Mean in the Stock Market?
To understand if a market is overvalued, you must look at the relationship between price and earnings. A market is considered overvalued when stock prices rise much faster than the actual profits earned by those companies.
Imagine a shop that normally sells a product for Rs. 1,000. If people suddenly start paying Rs. 1,500 for the same product simply because they expect future demand to rise, the product has become expensive. The same principle applies to stocks and mutual funds.
Does an Expensive Market Always Crash?
No. This is the biggest misconception among retail investors. A market can remain expensive for months or even years if company earnings continue to grow at a healthy pace. Similarly, a cheap market can remain cheap if business and economic conditions stay weak.
How Do Financial Experts Measure Market Valuation?
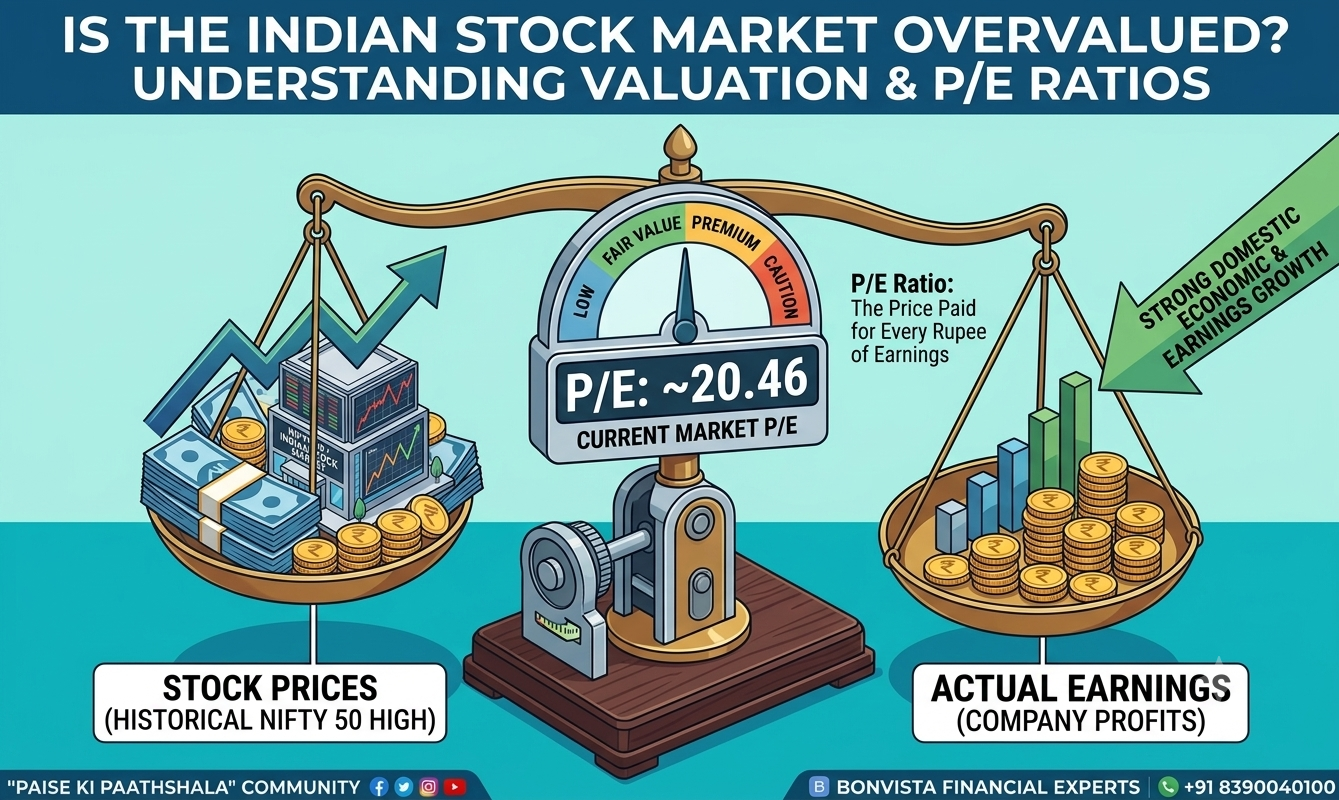
The primary indicator used by financial advisors to measure stock market valuation is the Price-to-Earnings (P/E) ratio.
The P/E ratio tells us how much investors are willing to pay for every single rupee of a company's earnings. A high P/E ratio often indicates high optimism about future growth, while a lower P/E ratio may indicate market caution. However, the P/E ratio should never be viewed in isolation because interest rates, inflation, overall earnings growth, and macroeconomic conditions also matter significantly.
Are Indian Markets Trading at Higher Valuations Today?
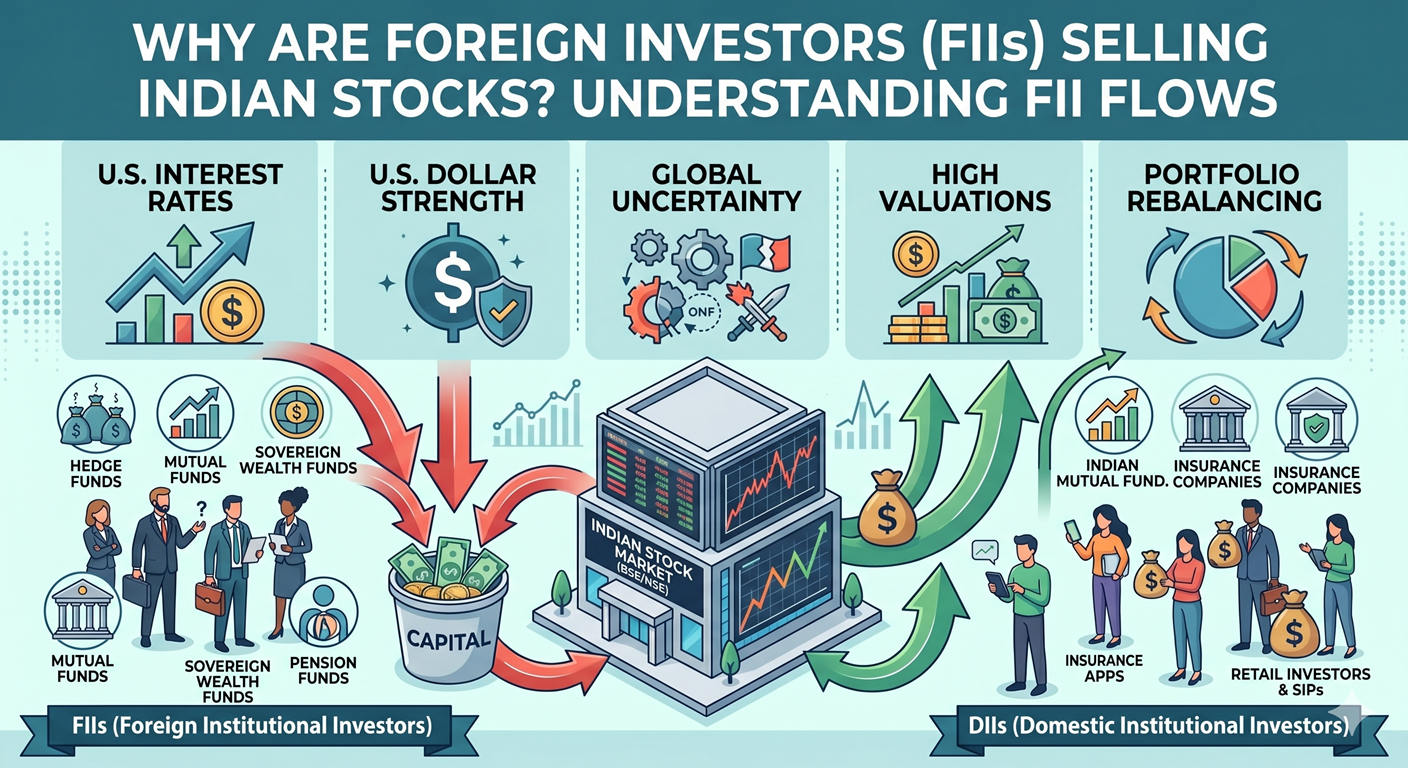
India continues to attract massive investments because of strong domestic economic growth, rising consumption, rapid digitalisation, heavy infrastructure spending, and new manufacturing initiatives. Furthermore, increasing participation by retail investors through SIPs has provided a strong backbone. Domestic mutual funds now receive steady, massive monthly inflows, which heavily reduces the Indian market's dependence on foreign institutional investors.
When looking at historical data, the average Nifty 50 trailing P/E ratio over the last 20 years (since 1999) is approximately 20.9.
The current Nifty PE is hovering around 20.46. This means the Nifty is currently trading right around its historical average PE. For context, in the years 2023 and 2024, the PE was trading around 22 to 23, which was slightly more expensive than average.
Quick Guide to Interpreting the Nifty 50 P/E Ratio:
-
Under 18: Historically attractive valuation
-
18 to 22: Fair market valuation
-
22 to 25: Premium valuation
-
Above 25: Caution zone
Join the Paise ki Paathshala Community! Want to understand market trends before you invest? Join a growing community of 280+ smart investors dedicated to financial literacy. Get access to free resources, daily financial facts, and the latest market news. Join Paise ki Paathshala
A Look at History: Nifty P/E Ratio During Major Market Events
History provides the best lessons on how valuations behave during periods of high volatility. Here is a breakdown of major market events and their corresponding valuations:
| Major Event | Approx. Nifty P/E | Market Context | Investor Sentiment |
|---|---|---|---|
| 2008 Global Financial Crisis | 12-13x (bottom) | Sharp market crash, panic selling | Extreme fear; valuations became historically attractive. |
| 2013 Taper Tantrum | 18-19x | FIIs withdrew money after the U.S. Federal Reserve signalled policy tightening | Cautious, but valuations stayed close to long-term averages. |
| 2020 COVID-19 Crash | 20-21x in March, then 30x+ later in 2020 | Earnings collapsed during the pandemic, causing the reported trailing P/E to rise sharply even after prices recovered | This is a reminder that P/E can be misleading when earnings temporarily fall. |
| 2024 Bull Market | 22-23x | Strong domestic inflows, resilient economy and earnings expectations supported premium valuations | Optimistic but not at historical extremes. |
| 2025-2026 | 21-23x | Valuations moderated as earnings improved while markets remained relatively strong | Slightly above long-term averages but lower than the peaks seen during the post-pandemic period. |
Can Valuations Become Risky?
Yes. If market expectations become too high and company earnings fail to keep pace with those expectations, stock prices usually correct. Additionally, global macroeconomic events such as higher US interest rates, geopolitical tensions, crude oil price spikes, or weak corporate earnings results can also trigger severe market volatility.
In 2008, the market corrected sharply during the global financial crisis. In 2020, markets crashed during the pandemic but recovered much faster than many expected. The historical data proves one thing: Investors who stayed invested and continued their mutual fund SIPs benefited far more than those who exited the market in panic.
Common Mistakes Retail Investors Make During Market Highs:
To protect your wealth, avoid these frequent retail investing mistakes:
- Stopping active SIPs after reading negative news headlines.
- Investing all available lump-sum money at one time when markets are euphoric.
- Chasing trending stocks that have already risen sharply.
- Completely ignoring proper asset allocation strategies.
- Trying to perfectly predict every market correction.
What Should Investors Do Instead?
If your financial goals are long-term, continue your SIPs without interruption. If you have a lump sum to invest and valuations appear stretched, invest that money gradually through staggered investments or a Systematic Transfer Plan (STP).
Protect your portfolio by diversifying across equity, debt, gold, and alternative investment funds (AIFs) instead of putting everything into a single asset class. Finally, review your portfolio periodically (once or twice a year) instead of reacting daily to market noise.
Myth vs. Fact: Market Valuations
- Myth: High valuations always mean an immediate market crash is coming.
- Fact: Expensive markets can stay expensive if corporate earnings keep growing.
- Myth: I should hold my cash and wait for the perfect time to enter the market.
- Fact: Nobody consistently predicts market tops and bottoms.
- Myth: SIPs should be stopped or paused during market corrections.
- Fact: Corrections actually allow your SIPs to buy more mutual fund units at lower prices, averaging out your cost.
Final Thoughts on Market Valuations
Valuation is a highly important indicator, but it is not a crystal ball. The current valuation of the NIFTY 50 is floating right around its long-term average, meaning the Indian market is currently neither incredibly cheap nor dangerously expensive.
Instead of constantly asking whether the market is overvalued, ask yourself whether your portfolio is prepared for different market conditions. Markets will always experience temporary ups and downs, but patient investors who stay disciplined are much more likely to create generational wealth than those who continuously try to time every movement.
Remember: Time in the market is usually more rewarding than timing the market.
Need Help Structuring Your Investment Portfolio? Don't let market noise dictate your financial future. Bonvista's financial experts are here to help secure your family's wealth, optimize your cash flow, and ensure your investments are perfectly aligned with your life goals.
Call our experts today at +91 8390040100 or book a Meeting with our experts to start your journey to lasting financial freedom!
Follow for daily updates: WhatsApp | LinkedIn | YouTube | Instagram | Facebook | X | Pinterest
Disclaimer: This article is for educational and informational purposes only and does not constitute financial or investment advice. Investors should consult with their certified financial planner or wealth manager before making any investment decisions. Mutual fund and gold investments are subject to market risks.