.png)

Bonvista Financial Services Pvt. Ltd.
Alpha and beta are the two most widely used tools in the financial sector. These tools measure a mutual fund's stock market performance, reaction, and interaction.
The Standard Deviation, Sharpe Ratio, P/E Ratio, and R-Square are some additional metrics or techniques that are useful in assessing the performance of a fund. To ascertain which fund is statistically outperforming its peers, these metrics are used in conjunction with alpha and beta.
The performance of an asset manager in directing a fund toward profitability relative to the benchmark index is referred to as "Alpha." "Beta," on the other hand, tracks and evaluates how a fund reacts to market volatility, or how closely its prices follow changes in the benchmark index.
An index that establishes the benchmark by which the performance of funds, securities, etc., is evaluated is known as a benchmark.
The baseline for alpha in Mutual Funds is 0.
If the Alpha is a negative number, it indicates that the performance of the Mutual fund is below the benchmark. If the Alpha is zero, it means the performance graph of the fund is said to be exactly in line with the benchmark index. Additionally, when a mutual fund's alpha is positive (more than 0), it indicates that the mutual fund has outperformed the benchmark index.
The baseline for beta in Mutual Funds is 1.
A beta value of 1 indicates that a particular fund reacts to market volatility in an equivalent manner, meaning that changes in its price are comparable to those of benchmarks. A value greater than one indicates that the price movement of a particular fund is more substantial than that of the benchmark. The opposite is represented by a value less than 1.
Importance of Alpha and Beta:
In order to make well-informed investment decisions, it is critical to evaluate the mutual fund's historical performance before choosing one, regardless of whether it is a capped fund, ELSS, or another type.
A crucial tool for assessing a fund's performance over various market periods is a ratio. It also supports in the production of significant data for calculating its prospects, including risk factors, sustainability, and growth potential.
Even though these forecasts may differ from the actual outcomes, they still give the potential investor a useful picture to help guide his or her choice.
The alpha ratio helps investors to determine whether an asset or fund is worth pursuing, depending on the asset manager’s capability to earn profits.
For instance, an asset manager's alpha ratio would be 3% if they were able to generate a 10% return on a particular mutual fund compared to an 7% benchmark index. Investors choose to make investments in mutual funds based on the alpha ratio, which is approximately 1.5. Be aware that the alpha ratio in mutual funds should not only be based on current data, but also on the average of past performance.
In the same way, a mutual fund's beta ratio provides investors with information about how volatile the fund is in reaction to changes in the market. It is up to the investor to decide which fund would best fit his or her financial goals.
Assuming a particular mutual fund's beta ratio is 0.6, it indicates that the fund is 0.4, less volatile than the benchmark index. Compared to ratios at par or above 1, a beta ratio value of 1 denotes a lower level of risk and growth potential.
A lower beta ratio in mutual funds is always preferred by investors with a low tolerance for risk since it shows a more stable reaction to a volatile market environment. Similarly, investors seeking higher returns would favor beta ratios of one or greater.
Other Ratios in Mutual Funds to consider while performance assessment:
Several different ratios assess a fund’s performance apart from alpha and beta.
Standard deviation (SD):
It is used to quantify how much a set of data deviates from the mean or average. The standard deviation shows how returns from mutual funds have deviated from the previously determined average or mean during various market phases. Investors and financial advisors use this information to determine the volatility of a particular fund.
Sharpe Ratio:
This ratio assesses a fund's return to the risk it takes. The process of calculating the Sharpe ratio includes deducting the risk-free rate (RFR) from the mean figure. In short, it facilitates the analysis of the profits obtained at different levels of risk. In simple terms, it stands for the investment's risk-adjusted return.
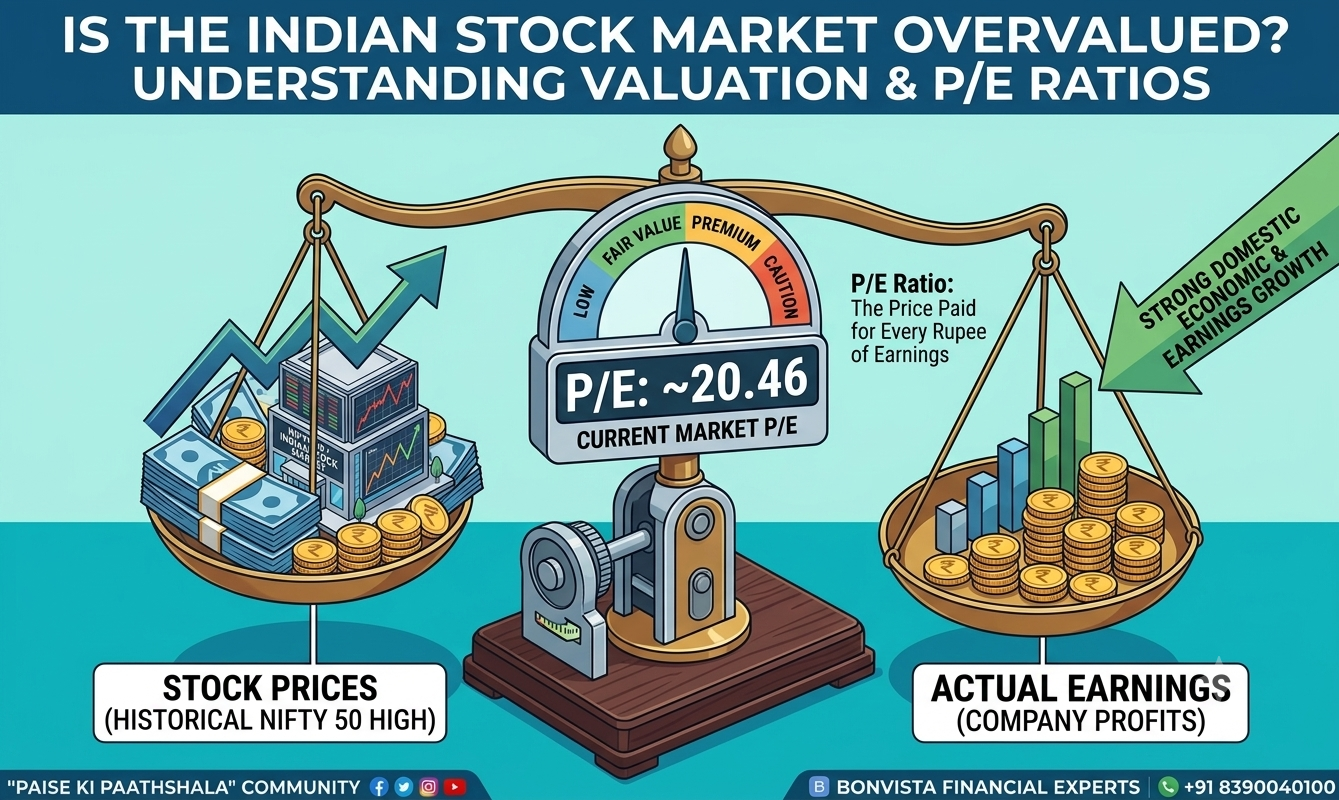
P/E Ratio:
Price to Earnings Ratio indicates how much a single unit of a fund can earn and what price is to be paid for that unit. It is the ratio between the current price of a single unit of a fund and its earnings per share it.
R-Square:
It shows the proportion of fund returns that follow changes in the current benchmark index. This approach is, in theory, the most similar to alpha and beta ratios. Figures for the R-squared ratio fall between 0 and 1. While a value of 1 indicates that changes in the benchmark index reflect changes in fund returns, a value of 0 indicates that no percentage of the funds in a portfolio respond to changes in its corresponding benchmark index.
Bottomline:
Alpha and beta provide a comprehensive view of the past performance of a mutual fund or portfolio and provide reliable information for future forecasts. It assists investors by enabling them to make a decision that best aligns with their investment goals.
A person can invest in mutual funds with a beta of less than one if they value higher returns over lower risk. Similarly, the alpha of an asset manager in mutual funds can also be used to choose an asset.